
In today’s digital world, having a solid online presence is crucial for businesses to stay competitive and grow. But simply having a website is not enough. You must understand how users interact with your site to optimize the user experience. This is where web heatmaps come in.
Busatools offers an advanced heatmap tool that provides valuable insights into user behavior on your website. You can quickly identify user pain points and friction areas with intuitive visual data. Read on to understand how Busatools’ heatmap can help you enhance your website’s effectiveness.
Introduction to Website Heatmaps
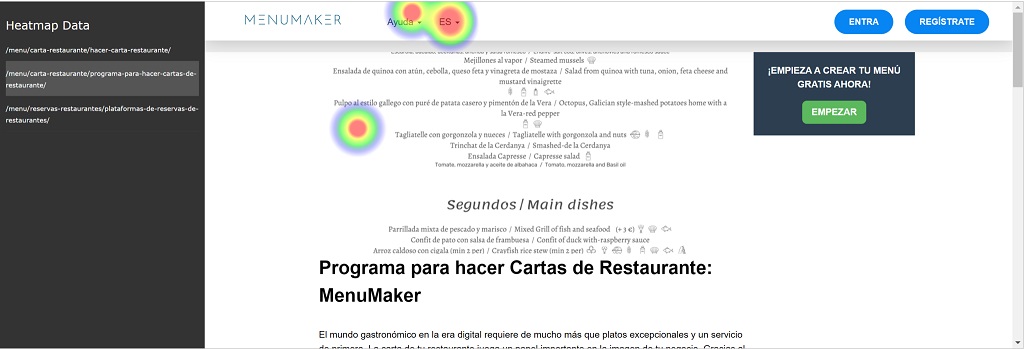
A heatmap is a graphical representation of data using colors to indicate activity levels. A web heatmap illustrates user clicks, taps, and mouse movements.
The heatmaps use different colors to display dense areas of clicks (hot) and regions with minimal clicks (cold). Red zones indicate high user activity, while blue zones show low user activity.
Heatmaps enable you to “see” how visitors interact with your site by visualizing the user journey. You gain visibility into critical pages and elements that attract attention or cause friction.
With these behavioral insights, you can better optimize page layouts, navigation, forms, buttons, and other elements that impact conversions and overall user experience.
Key Benefits of Using a Web Heatmap
Pinpoint Usability Issues
Heatmaps instantly highlight usability problems on your site. You can identify pain points where users struggle to find information or complete desired actions.
For example, inadequate call-to-action (CTA) buttons, confusing navigation, and poor page layouts are easily spotted on a heatmap. You’ll also notice if important content is going unnoticed.
Understand Visitor Behavior
By recording all visitor activity, heatmaps provide an accurate depiction of how users interact with your site. You gain insight into their interests, engagement levels, scrolling behavior, and more.
The visual data gives you a better sense of which pages attract users and what catches their attention on those pages. You can see their natural user flow and identify areas of friction.
Optimize Site Content
Heatmaps make determining the most viewed content and poorly performing areas easy. You can refine page layouts to showcase popular content and improve the visibility of critical sections.
If certain buttons, forms, or calls-to-action are rarely clicked, you can relocate them or adjust their design. Heatmaps empower you to create more user-friendly page layouts.
Identify Bounce Rates
Hot zones at the top of a page indicate engaging content. However, minimal heatmap activity near the bottom shows high bounce rates.
By revealing landing pages with high bounce rates, heatmaps help you understand why visitors leave and how to retain them better. You can experiment with layouts, content formatting, and other enhancements to reduce bounce rates.
Prioritize Changes
With limited time and resources, heatmaps empower you to focus on high-impact site enhancements. By revealing your site’s most significant usability flaws and opportunities, heatmaps help prioritize fixes and optimizations for the most important ROI.
How Busatools’ Heatmap Works
Busatools uses state-of-the-art technology to track all visitor activity on your site accurately. The lightweight JavaScript code installed on your pages records every mouse movement, scroll, click, and tap without impacting site performance.
Complete User Session Recording
The heatmap tool captures the entire user session across multiple pages. You gain a comprehensive understanding of the user journey from landing pages to conversion points.
The session recordings highlight visitor behavior patterns as they navigate your site. You see which paths they follow most and where journeys are cut short.
Real-Time Data Collection
Heatmap tracking is real-time, so you can instantly visualize user activity on your live site. There is no need to recreate behavior in a lab environment.
The real-time capabilities also allow you to test changes and see the heatmap impacts rapidly. You gain insights much faster compared to traditional analytics.
Privacy Protection
While collecting actionable data, Busatools is careful not to record any personally identifiable visitor information. The focus is solely on understanding user flows.
The heatmap tool provides transparent tracking and recording to improve the user experience without compromising privacy. This builds user trust while gaining valuable behavior insights.
Customizable Reports
Busatools allows the generation of heatmap reports for specific date ranges and user segments. You can also apply filters to analyze the behavior of first-time vs returning visitors, mobile vs desktop users, and more.
Comparing heatmaps side-by-side gives you a more granular perspective of how visitors interact with your site. You can surface nuances you may have otherwise missed.
Key Heatmap Features
Click Heatmaps
The click heatmap reveals every tap, click, and touchpoint on your site pages in color-coded heat zones. This invaluable visualization is like x-ray vision into exactly where visitors are interacting.
With click heatmaps, you can instantly identify the most clicked elements and wasted clicks on ineffective CTAs, difficult navigation, etc.
Scroll Heatmaps
The scroll heatmap uses color gradients to illustrate scrolling behavior on long web pages. You can easily discern where users scroll the most and where their journey ends as they lose interest and drop off.
Optimizing page lengths and positioning critical information higher can significantly boost engagement based on scroll heatmap findings.
Move Heatmaps
This heatmap displays all mouse movements, hovers, and gestures as color-coded trails. You gain insight into cursor activity across page elements even if no clicks occur.
Uncover areas that attract attention versus being ignored and refine content positioning accordingly.
Attention Heatmaps
Attention heatmaps use gaze-tracking algorithms to estimate visual attention levels across your page in hot and cold zones.
Discover which sections visitors pay the most attention to and which get ignored. Refocus layouts to captivate your attention where you want it.
Funnel Heatmaps
Funnel heatmaps illustrate engagement and dropoffs across each step for multi-page conversion funnels. Visually identify leaks in your funnel and weaknesses that impact conversions.
Form Analytics
Gain a crystal clear view of how visitors interact with forms on your site. The heatmap tool tracks every field tap, click, scroll, and typing activity.
See which fields attract more focus and where visitors struggle to convert. Refine from UX for smoother completion.
Custom Events
In addition to automatic tracking, you can manually tag custom events or page elements to isolate heatmap clicks. Spotlight critical areas to analyze more closely.
Tie Heatmaps to Other Busatools Tools
Busatools offers an all-in-one website analytics platform with heatmaps seamlessly integrated with other powerful features.
Visitor Recordings
Complement click heatmaps with complete session recordings to see users interacting live on your site. Watch actual visitor sessions play out with mouse movements, scrolling, typing, clicks, and more. Gain a holistic view of behavior.
User Statistics
Enrich your heatmap insights by correlating to user traffic data like geolocation, device, browser, page visit count, and more. Discover key user trends tied to behavior patterns.
Form Analytics
Connect the dots between form interactions and conversions. See precisely where users engage and struggle in form filling to maximize conversions.
A/B Testing
Run A/B tests and instantly view heatmaps from both versions. The visual insights help assess how layout, copy, or other changes impact behavior and conversions.
Funnels
Tie your heatmaps to conversion funnel data. Visualize engagement and fallout across each funnel stage to optimize the path to conversion.
Get Started with Busatools’ Heatmap
Here are a few tips to help you get started with heatmaps and maximize the benefits:
- Set specific goals – Clarify what key questions you want the heatmap to answer, such as landing page effectiveness, checkout friction, etc. This focuses on analysis.
- Map essential journeys – Analyze user behavior across critical processes like account signup, purchases, and lead gen. Identify key dropoff points.
- Segment users – Compare heatmaps across user personas, traffic sources, devices, locations, and other segments. Uncover unique insights.
- Use filters – Isolate clicks, attention, or other data using filters to spotlight areas for closer inspection.
- Track overtime – Build heatmap benchmarks and track changes over weeks and months to measure ongoing optimizations.
- Combined with surveys – Survey users for deeper insights into motives and preferences that complement the behavior data.
- Take action – Don’t just analyze. Turn heatmap findings into site, content, and UX enhancements that boost conversions.
The Power of Insights from Busatools’ Heatmap
Busatools offers an advanced heatmap, unlike any other tool on the market. The real-time visual intelligence into visitor behavior provides unmatched clarity.
You immediately see engagement levels, pain points, and opportunities across every inch of your website or app. Putting users under the microscope reveals how to optimize experiences and business outcomes.
Sign up today at Busatools.com to unlock the power of heatmaps and take your customer engagement to the next level!
Frequently Asked Questions
What data does the heatmap show?
The heatmap displays user activity, including clicks, taps, mouse movements, scrolling, hover heatmaps, visual attention, and more. You see exactly where and how visitors are interacting.
Does it work on mobile apps?
Yes, Busatools’ heatmap seamlessly tracks activity in mobile apps to optimize in-app experiences.
Can I filter heatmaps?
Yes, you can apply filters to isolate data like first-time vs returning visitors, desktop vs mobile, traffic source, and other filters for deeper analysis.
How much web traffic do I need?
Busatools heatmaps work even with relatively low site traffic. However, more traffic provides more behavior data for more granular insights.
Is heatmap data retroactive?
The click heatmap shows all historical activity from when tracking is installed on your site. This allows analyzing behavior over any period.
Conclusion
Understanding visitor behavior provides invaluable direction to optimize digital experiences and improve outcomes. Busatools makes user intelligence accessible through advanced, real-time heatmap visualization.
Leverage the power of heatmaps to unlock insights, eliminate friction, and craft seamless user journeys. Sign up for Busatools to visualize the path to online success.
Tags: Web Heatmap, web heatmap tool


Leave a Reply